logo

RedmineKanban

Login

Tempo di distribuzione del piombo

Tempo di distribuzione del piombo

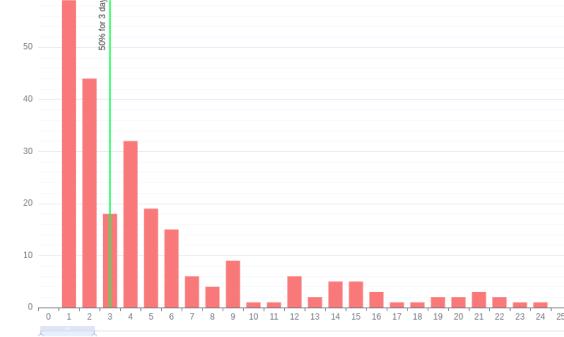
Il grafico mostra il tempo necessario per passare dalla creazione al completamento dei proble.

Diagramma di flusso cumulativo

Diagramma di flusso cumulativo

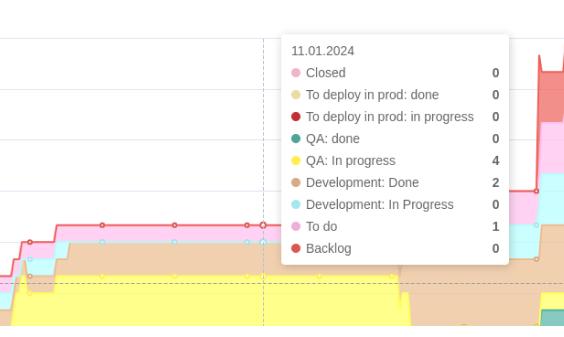
Il grafico consente di capire cosa sta accadendo nel progetto o nel lavoro sul prodotto e di vedere l'impatto dei cambiamenti nel flusso di lavoro sulle principali metriche Kanban: Lead Time, WIP e throughput.

Rapporti sui blocchi

Rapporti sui blocchi

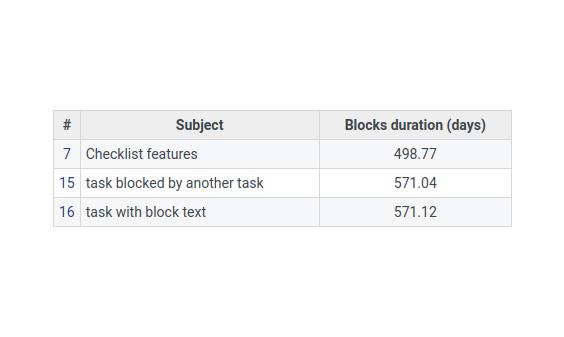
Essere consapevoli di quanto tempo i attività sono stati bloccati e per quale motivo.

Rapporti sui tipi di blocco

Rapporti sui tipi di blocco

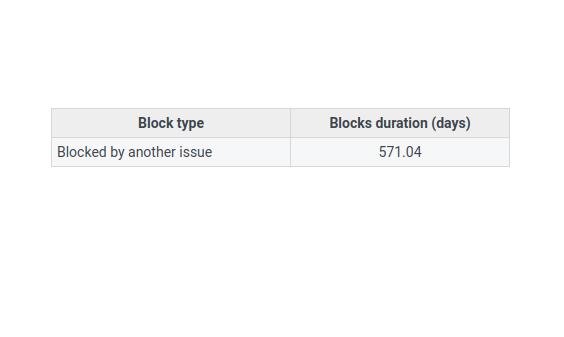
Riflette i tipi di blocco con la durata per ciascun tipo.

Un elenco più completo delle caratteristiche nella tabella di confronto delle versioni

Demo

Scopri tutte le funzionalità dei nostri plugin nella demo

Purchase

buy the plugin for only 200 €

Buy

Changelog

Versione 1.2

2025-06-19

Aggiunto

  • Throughput complessivo per tutti i progetti [29548].
  • Maximum number of issues, status for block report [30526].

Improved

  • Rounding of calculations for LTD [30059].

Versione 1.3

2025-09-10

Aggiunto

  • Numero di attività per il report sui tipi di blocchi [30534];

Fixed

  • Description for LTD [29306].

Compatibilità

  • Redmine5.0 - 6.0
  • BrowserChrome, Firefox, Safari, Edge
  • DatabasesMySQL 5.7, MySQL 8.0, PostgreSQL 14-16, SQLite
  • Plugin advanced_charts, appearance_custom, additional_tags, additionals, module_manager, periodic_reminder, periodictask, redmine_advanced_checklists, redmine_app_notifications, redmine_banner, redmine_impersonate, redmine_issue_dynamic_edit, redmine_issue_templates, redmine_kanban, redmine_local_avatars, redmine_searchable_selectbox, redmine_theme_changer, redmine_wysiwyg_editor, user_group_editor, view_customize

Installing and configuring

    Installation:
    1. Copy the redmine plugin folder to the plugins/ folder.
    2. Run the migration in the Redmine root folder.
    3. Stop and start Redmine.In some redmine installations (for example, when working in docker), it is important to stop and start the redmine server, and not restart it. Sometimes, when restarting, the boards are not displayed.
    Customization:
    1. Configure user roles in Administration -> Roles.
    2. Enable the Advanced Charts module for projects in the settings of each project or in Administration -> Advanced Charts.
    3. Check and change other plugin settings in Administration -> Advanced Charts.

Need help integrating plugins on your redmine?