Advanced Charts
Description
Advanced Charts is an analytical plugin for Redmine that provides data visualization tools to track team productivity and control workflows. With a set of interactive dashboards and reports, you can make informed decisions based on objective metrics.
Key Features
- 'Lead Distribution Time' chart
- 'Cumulative Flow Diagram' chart
- Blocks report
- Block types report
- Block period report
- Burndown chart
- Throughput
- Workload
- Set default display dates
Compatibility
Redmine: 5.0 - 6.1
Web Browsers: Chrome, Firefox, Safari, Edge
Databases: MySQL 5.7, MySQL 8.0, PostgreSQL 14-16, SQLite
Plugins: advanced_workflow, redmine_kanban, redmine_advanced_checklists, module_manager, appearance_custom, periodic_reminder, user_group_editor, queries_perfect, selectbox_autocompiler, cost_calculator.
Installation and Update
-
Remove the old version of the plugin from Redmine if it exists.
cd redmine/plugins
rm -r advanced_charts
-
Copy the new advanced_charts plugin folder into redmine/plugins/.
-
Run migrations in the root folder of Redmine
bundle exec rake redmine:plugins:migrate RAILS_ENV=production NAME=advanced_charts
-
Stop and start Redmine. (In some Redmine installations, like Docker, it is important to stop and start the server, not just restart it.)
Uninstallation
-
Run the uninstallation command in the root folder of Redmine
bundle exec rake redmine:plugins:migrate RAILS_ENV=production NAME=advanced_charts VERSION=0
-
Remove the advanced_charts plugin folder from redmine/plugins/
rm -r advanced_charts
-
Stop and start Redmine.
Configuration
- Configure user roles in Administration -> Roles and Permissions.
- Enable the "Advanced Workflows" module for projects in each project's settings.
- Check and modify other plugin settings in Administration -> Modules -> Advanced Charts.
Administration
Section "Roles and Permissions"
- View charts - Permissions for viewing the Reports page.
Section "Modules"
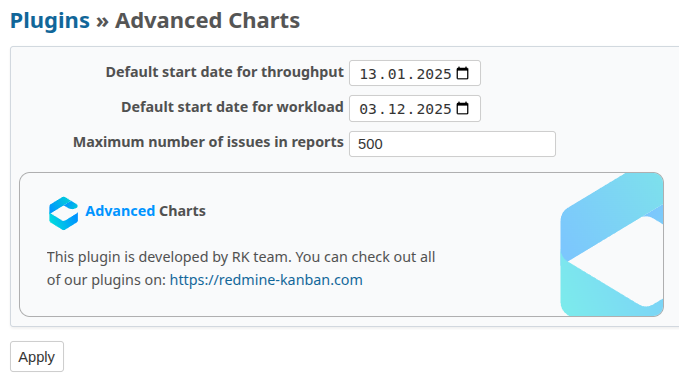
In Administration -> Modules -> Advanced Charts, you can configure:
- Default start date for the throughput report
- Default start date for the sprint load report
- Maximum number of issues in reports
Usage
The plugin includes the following charts and reports:
Lead Distribution Time
The LTD chart shows the distribution of days over which your issues pass from creation to completion for the selected period.
By understanding the number of issues completed within a certain number of days, you can:
- Analyze issue completion efficiency and identify areas for optimization in your processes;
- Predict how much time will be required to complete a new issue.
How the LTD chart works
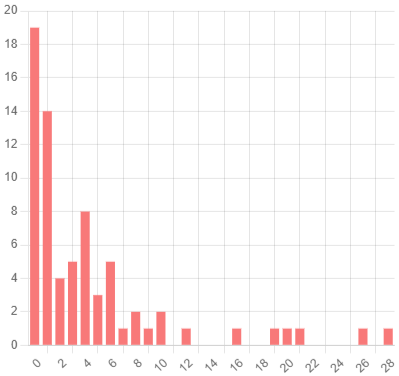
- X-axis - Days
- Y-axis - Number of resolved issues
In the chart above, we can see that on day 4, 8 issues were completed, and on day 10, 2 issues were completed.
Cumulative Flow Diagram
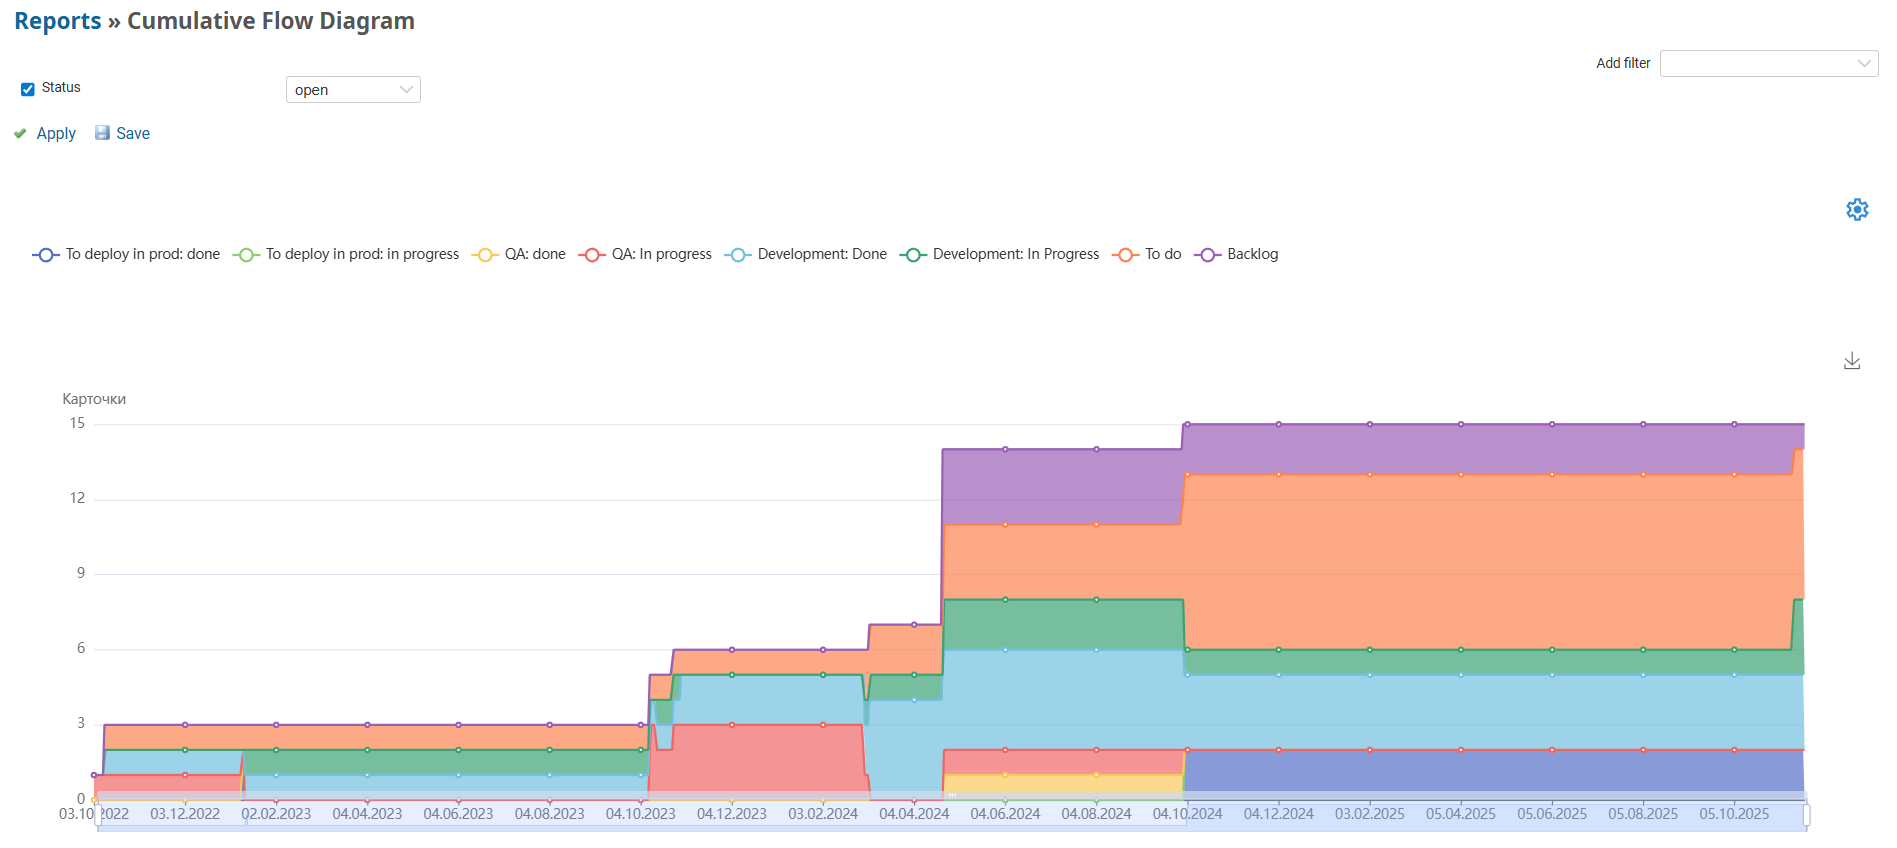
The Cumulative Flow Diagram visualizes the state of workflows in a project over a selected period, showing the number of issues in different statuses.
With the Cumulative Flow Diagram, you can:
- Identify bottlenecks and overloads in workflows;
- Track the stability of issue flow;
- Predict completion time based on current throughput.
How the Cumulative Flow Diagram works
- X-axis - Report period dates
- Y-axis - Number of issues
- Multicolored areas represent issues in different statuses
The diagram shows how issues accumulate and move between statuses, allowing you to analyze the balance between incoming issues and completed issues.
Blocks report
The Blocks report provides detailed analytics on issue downtime, focusing on block duration - a key metric for assessing the impact of downtimes on the project's progress.
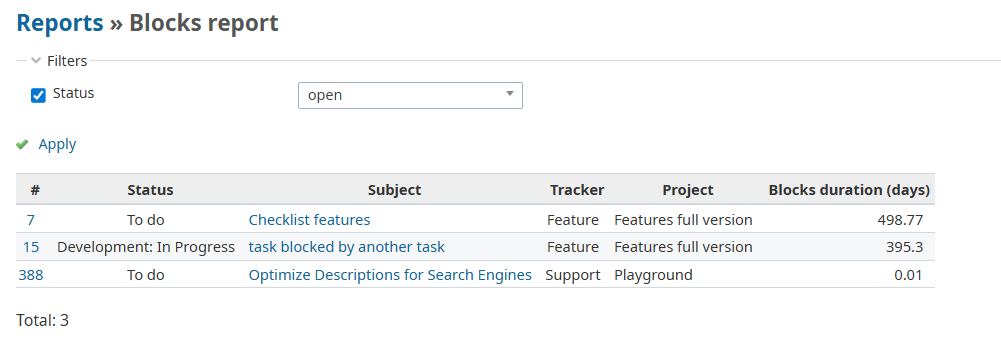
The report allows you to:
- Quickly identify all blocked issues in the project;
- Determine priorities for unblocking issues;
- Control the overall block status in real time.
The report shows all issues with active blocks, their current status, and block duration.
You can download the report in CSV format.
Block types report
The Block types report report provides analytics on the causes of downtime, grouping blockages into categories. The main purpose of the report is to identify which types of blocks have the greatest impact on the project based on total downtime.
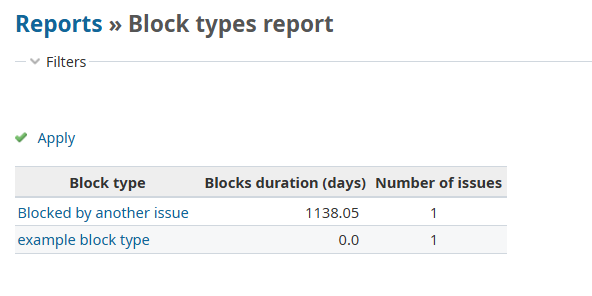
The report allows you to:
- Identify the most costly types of blocks — pinpoint the causes that lead to the longest downtimes;
- Compare the impact of different types of blocks on the overall project timeline;
- Focus team efforts on eliminating systemic issues rather than isolated cases.
The report displays statistics for each block type, including blockage duration and the total number of issues with that type of blockage.
For detailed analysis, you can click on any blockage type in the table. A detailed list of all issues with that block type will appear.

You can download the report in CSV format.
Block period report
The report provides a historical analysis of blocks over a selected time period, showing the dynamics of issue block and resolution.

The report includes issue ID, issue name, block time, average block time, and total block time.
You can download the report in CSV format.
Burndown Chart
The Burndown Chart shows sprint progress by comparing actual work completion to the planned pace.
Using the Burndown Chart allows you to:
- Track sprint progress in real time;
- Identify schedule delays promptly;
- Adjust workload distribution during the sprint.
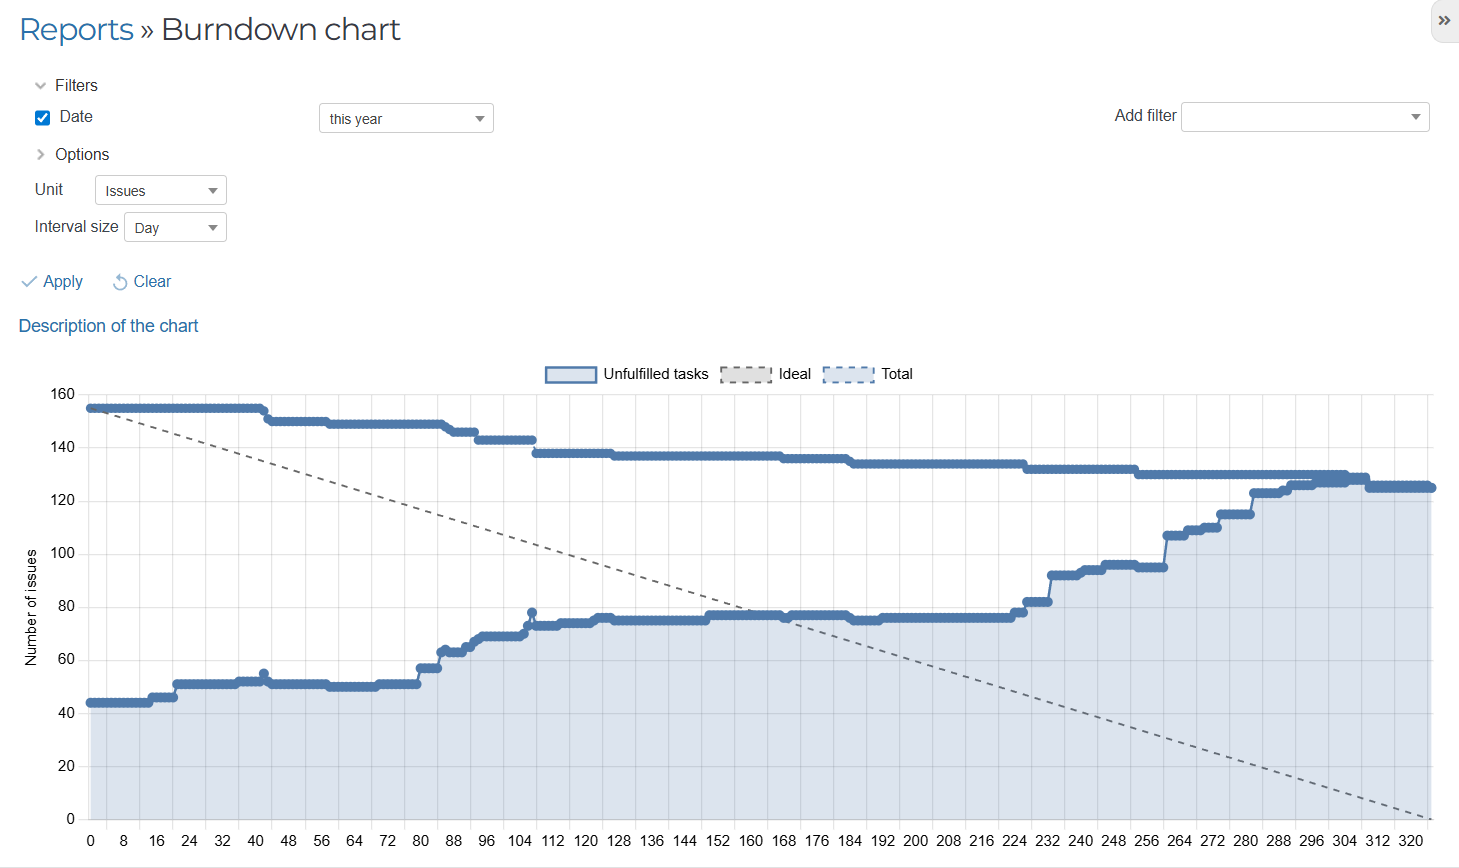
The chart displays an ideal burn-down line (plan) and actual performance, helping the team assess their chances of meeting sprint deadlines.
Throughput
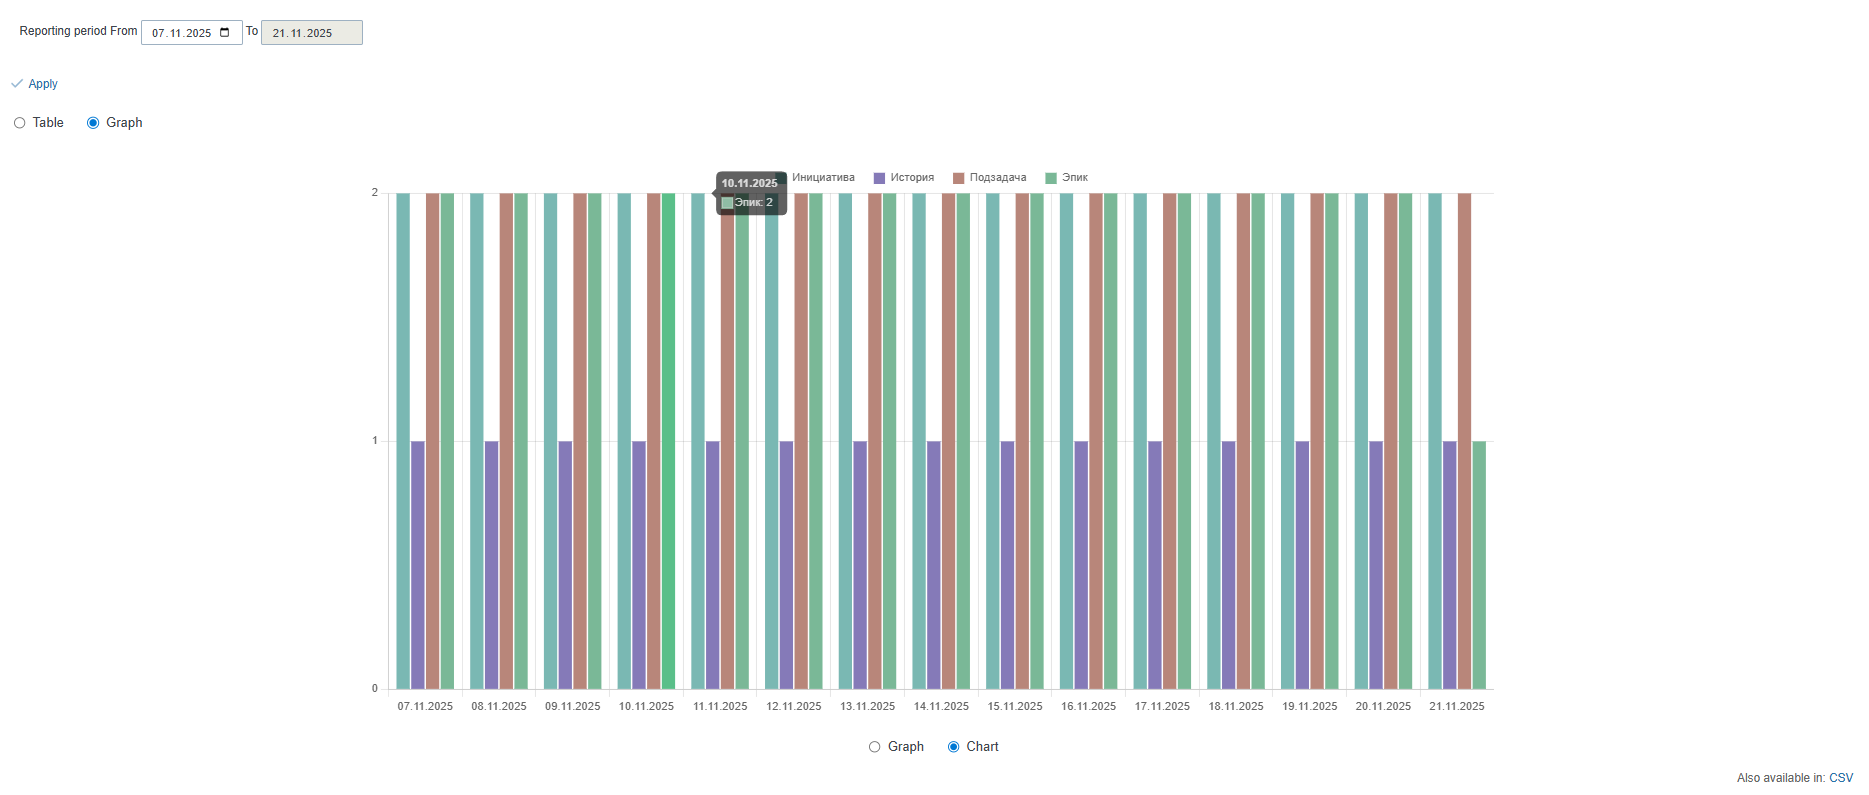
The throughput chart shows the number of issues completed by the team over a specified period (usually during a sprint).
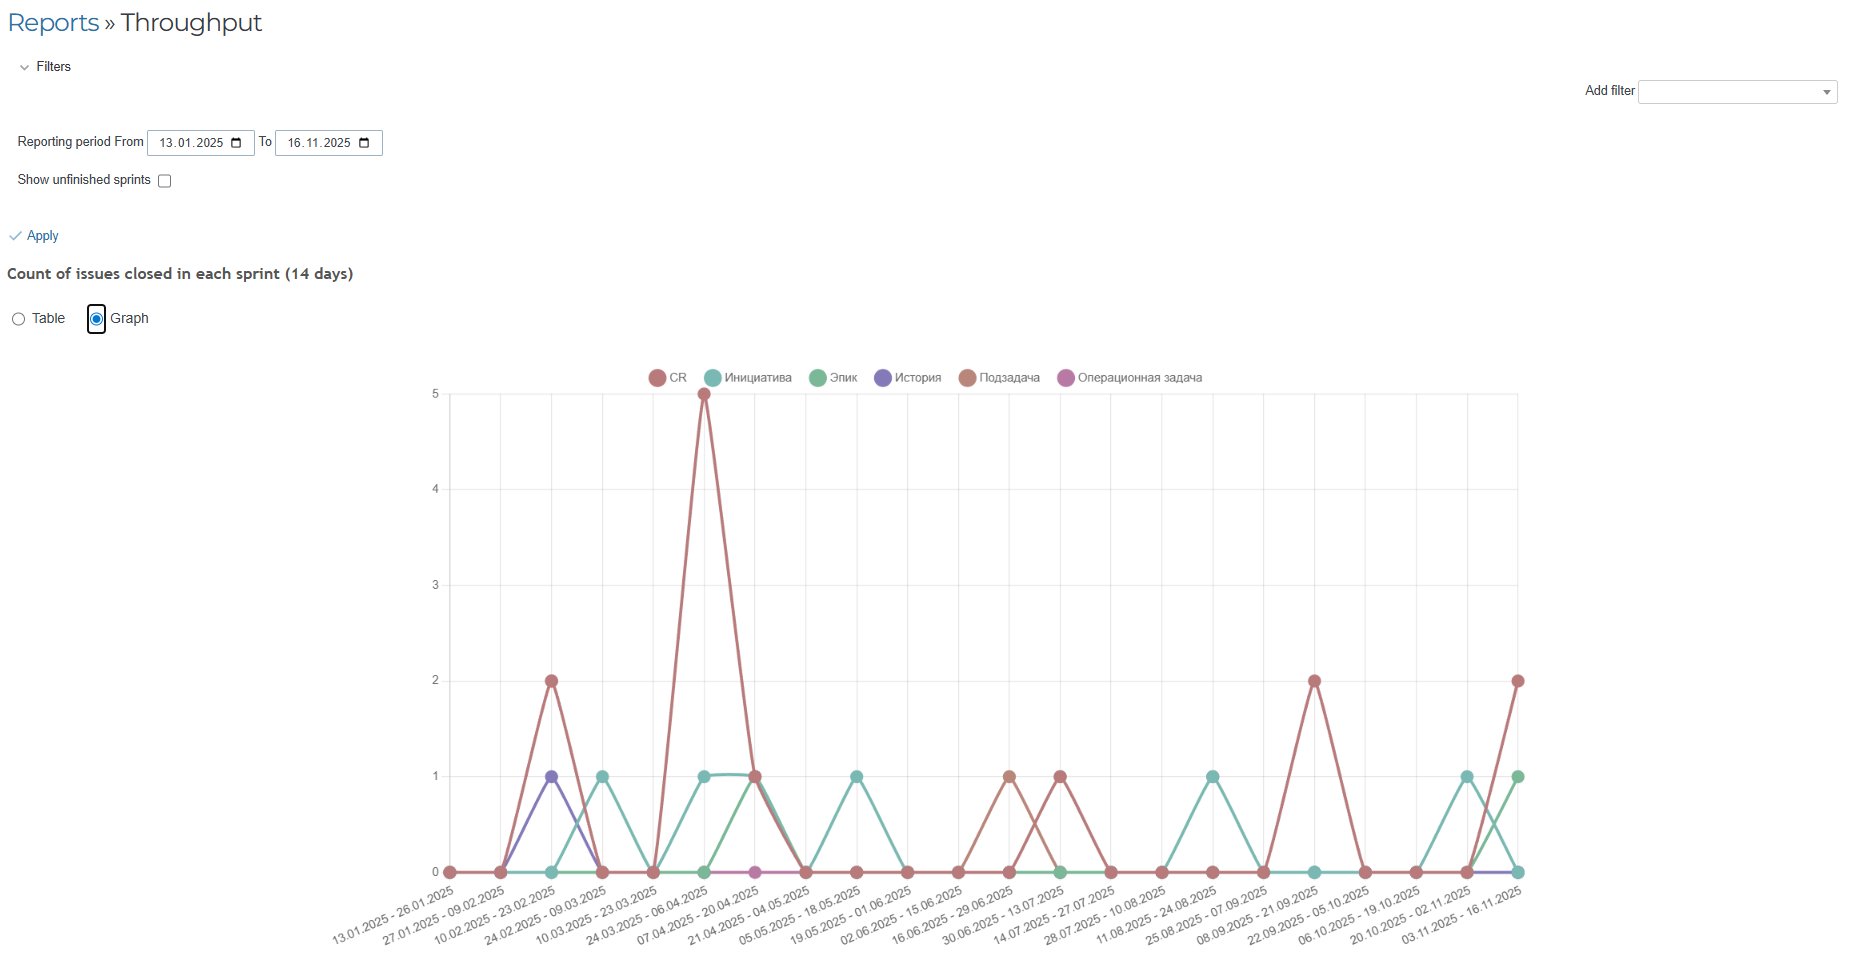
Throughput analysis helps you to:
- Measure team productivity in stable conditions;
- Predict the amount of work that can be done in future periods;
- Evaluate the impact of process changes on team efficiency.
You can also view it as a table:

You can download the report in CSV format.
Sprint Load
The "Sprint Load" report shows the dynamics of version and issue tracker changes in the current sprint as a table:

Tracker and version filters are mandatory. Clicking on the number of issues for a specific day will open a list of those issues.
Load analysis allows you to:
- Identify imbalances in issue distribution;
- Optimize team load for a more even distribution of work;
- Prevent overloading specific team members.
You can view it as a graph, diagram, and download the report in CSV format.
Graph:
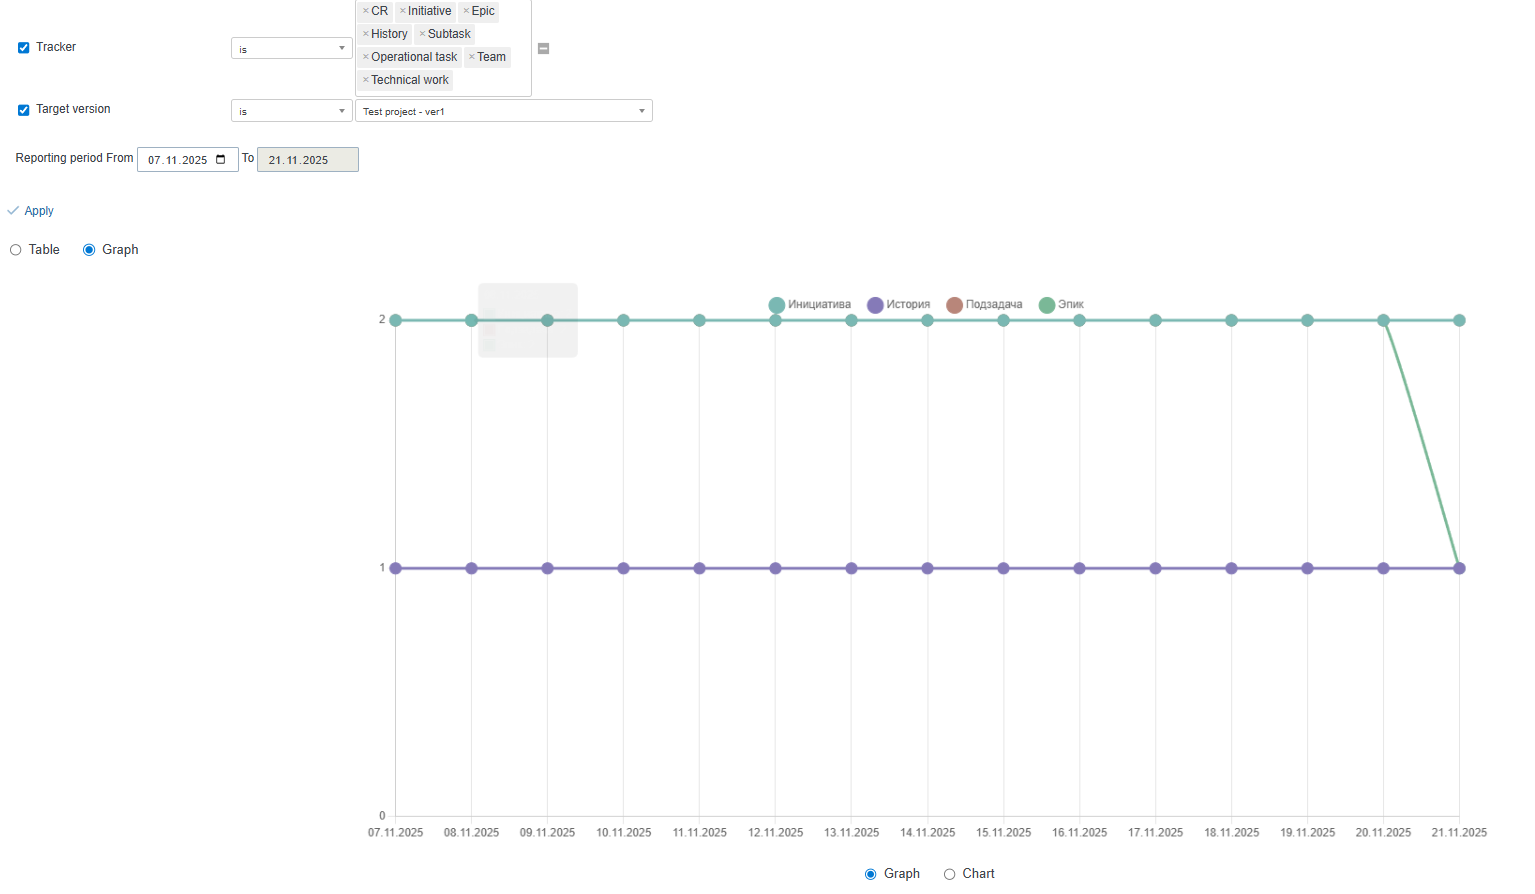
Diagram:
